 Rick Kennedy
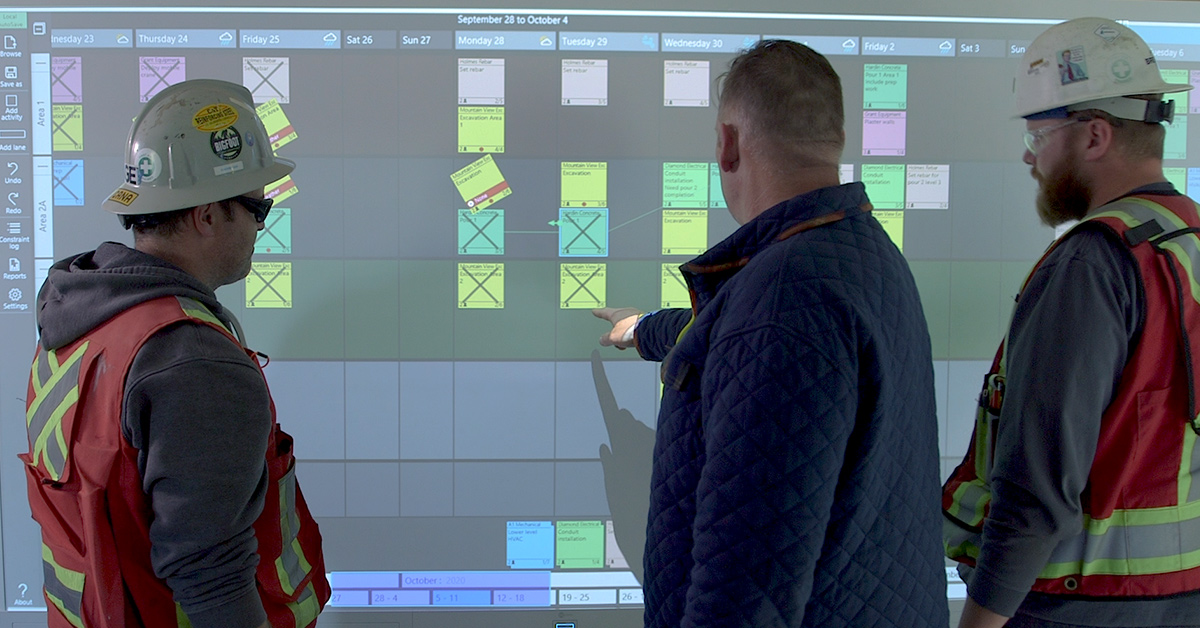
4 hidden features of Nialli Visual Planner you might be missing
Discover four overlooked features in Nialli™ Visual Planner, from crew tracking and Microsoft® Power BI reporting to constraint management and...
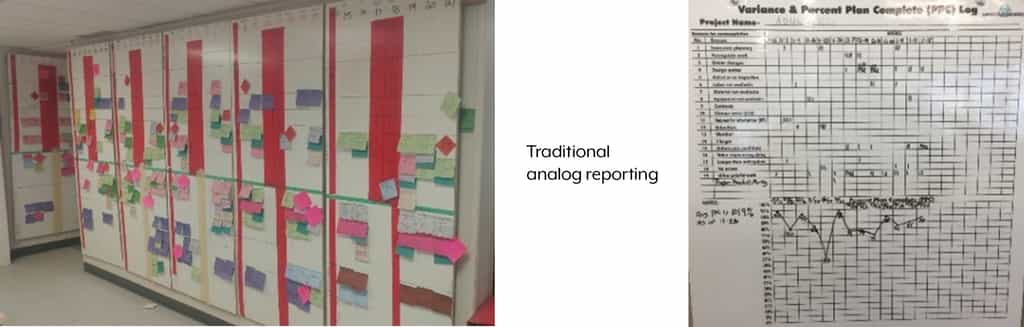
The Last Planner System®, using sticky notes and analog boards, has been proven to be a incredibly effective method of managing construction projects, driving team coordination and improving project performance. With some basic counting of cards, simple Percent Plan Complete (PPC) and Reasons for Variance charting is possible.
While more sophisticated analytics would be valuable, the time and effort to capture and interpret data in an analog environment is often impractical. The time required to transcribe sticky notes one by one, collate them and relate them to project variables is not sustainable and is far too demanding to be considered a lean practice. Furthermore, with data changing frequently – weekly or even daily – it is simply not worth the effort to capture it, as valuable as the data might be. So it’s not done, and learning and improvement from current practice is foregone.
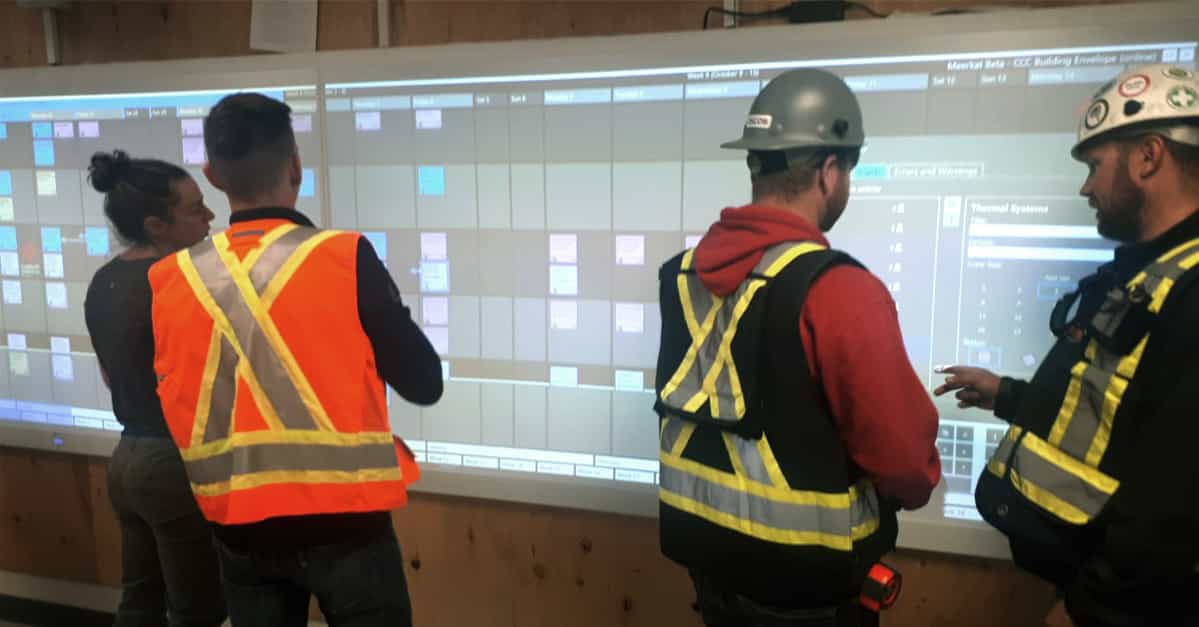
On the other hand, digital planning tools easily provide simple reporting like PPC and Reasons for Variance to track progress and spark improvements. Transitioning to a digital planning process like Nialli™ Visual Planner results in the automatic capture of a wealth of data. No incremental effort is required.
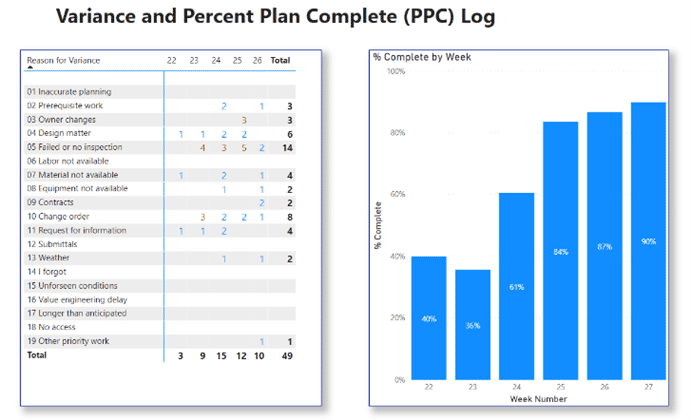
We are now able to unlock significant value in project data using data analytics tools like Power BI. Direct integration with analytics applications provides a “live link” to enhanced reporting and further data analysis. These applications provide flexibility in how data is viewed and include the ability for users to easily filter, sort and view information graphically, enabling users to customize reporting and drill into the data based on their own unique needs.
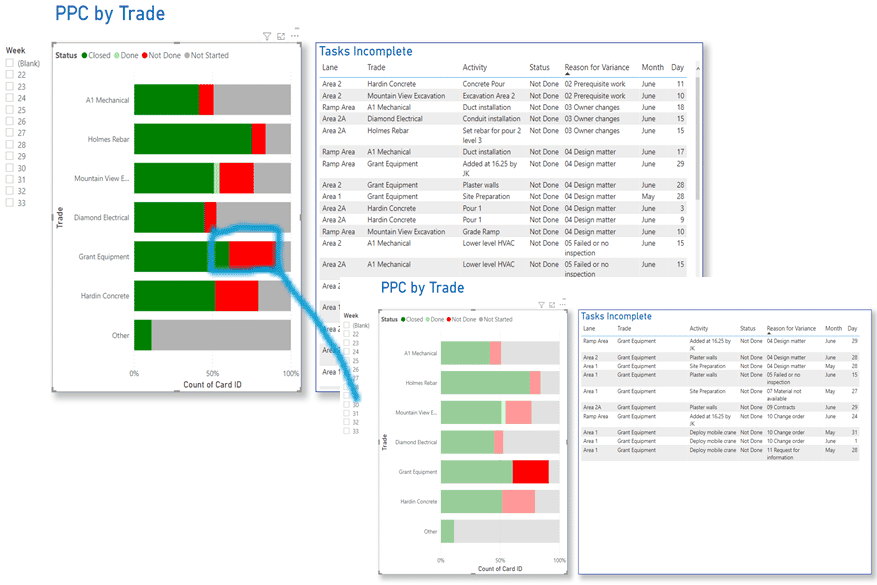
While some level of knowledge of the application is required to design the reports and dashboards (which could be done by an IT analyst), once created, it can put the power to view, analyze and interpret the data in the hands of users – more specifically – the individuals charged with project delivery and improvement.
As an example, the ability to simply click on a bar to drill in and filter the data can generate valuable insights and enable targeted discussions that can lead to process improvement.
Additional insights can be unlocked by transforming existing data. For example, by utilizing data fields in a particular way, it is possible to add productivity metrics to your reporting. By inserting planned measures (length, volume, etc.) when creating activity cards and inserting actual completion data when card status is set, it is then possible to report on productivity metrics.

Exported data can also be used to create connections to other applications. For example, this approach can link the master schedule to a digital Last Planner System, enabling visual comparisons of the current plan to the master schedule, identifying in a Gantt view where the project is off schedule.
These are some simple examples of how the power of digital data can be harnessed to improve practice and efficiency, obtain greater clarity of project expectations and increase leverage over competitors. There are, of course, many other possibilities on which organizations may capitalize, including reporting across multiple projects tracked over time. The first step must be to capture the data digitally in the planning and management process and begin the journey to continuous improvement.
Discover the digital pull planning tool that keeps conversations going and projects on track. When you use Nialli Visual Planner, you get the best of both analog and digital, with innovative technology that leverages familiar processes.


Discover four overlooked features in Nialli™ Visual Planner, from crew tracking and Microsoft® Power BI reporting to constraint management and...

Technology in construction is only as effective as the people using it. This article builds off of our recent webinar with Erin Khan, during...
%20(5).jpg)
Lean construction is all about identifying and eliminating waste in processes. Learn the acronym DOWNTIME to remember the 8 types of waste in...

1 min read
As so many practitioners know, implementation of the Last Planner System® (LPS) can lead to various benefits for a construction project, including...
1 min read
Pull planning is a collaborative Lean construction method where project teams work backward from a specific milestone to define the sequence...

1 min read
One of the fundamental tenets of Last Planner System® (LPS) is the ability for the team to congregate in a room and discuss challenges, make...