Nialli Visual Planner reporting

Generate actionable insights from your daily planning. Integration with Microsoft® Power BI allows Nialli Visual Planner users to generate advanced reports on metrics including Percentage Plan Complete (PPC) by trade, resource levels, outstanding tasks and more.

Video: How reporting works

This short video covers reporting available in Nialli Visual Planner and how to configure Microsoft Power BI.

Reporting overview

New to using Microsoft Power BI? Don't worry! While this application has powerful capabilities for data-savvy users, the Nialli Visual Planner integration has been set up in a way that's simple for new users.

Follow these steps to configure Power BI for the first time. Now, when you click 'Open Power BI' in the Reporting section of Nialli Visual Planner, your plan data will automatically be exported and sent to pre-configured Power BI reports.

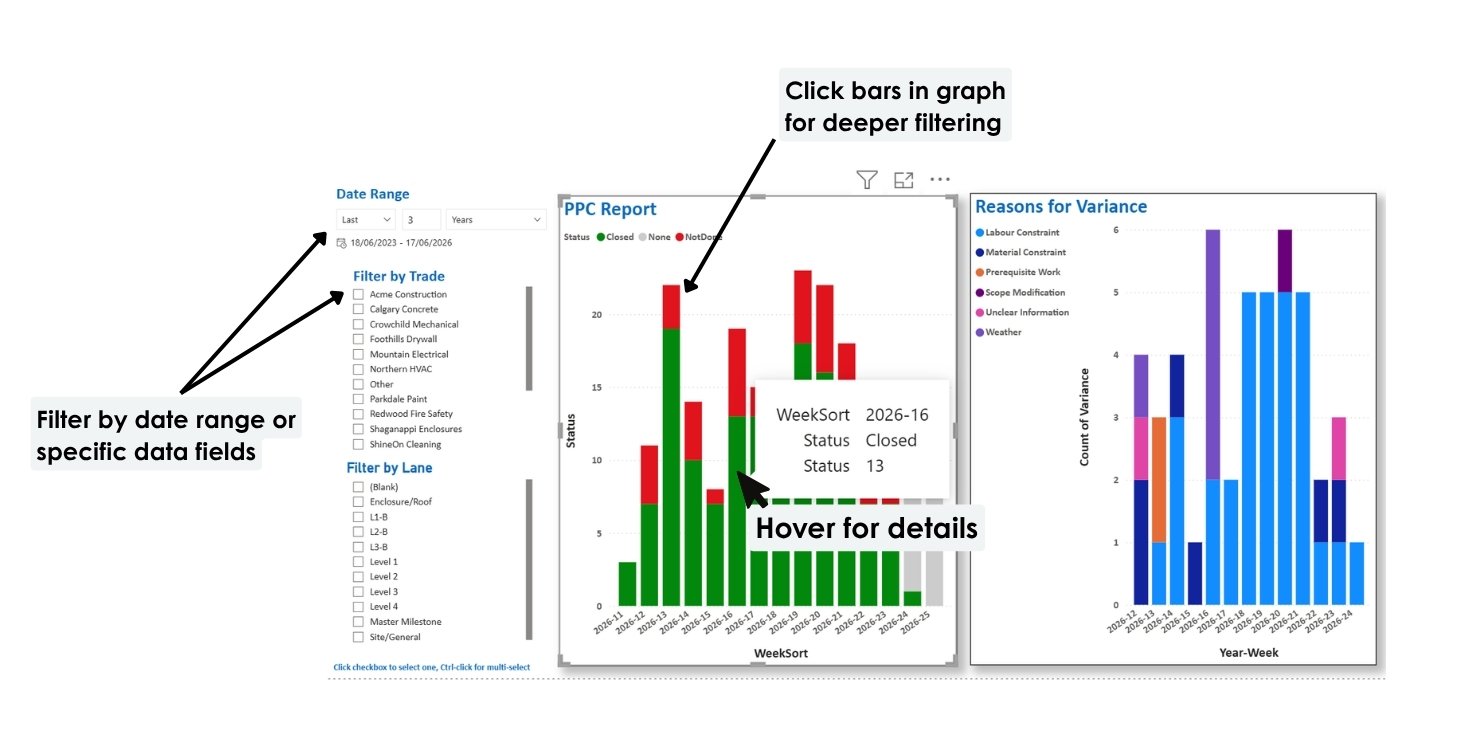
These reports are easy to navigate using the filters on the left side menu. Sort by date range, trade or work areas (lanes). Additional filtering is available by hovering over graphs and selecting graph objects.

Reporting overview - Nialli Visual Planner

Explore available reports

Team performance reports

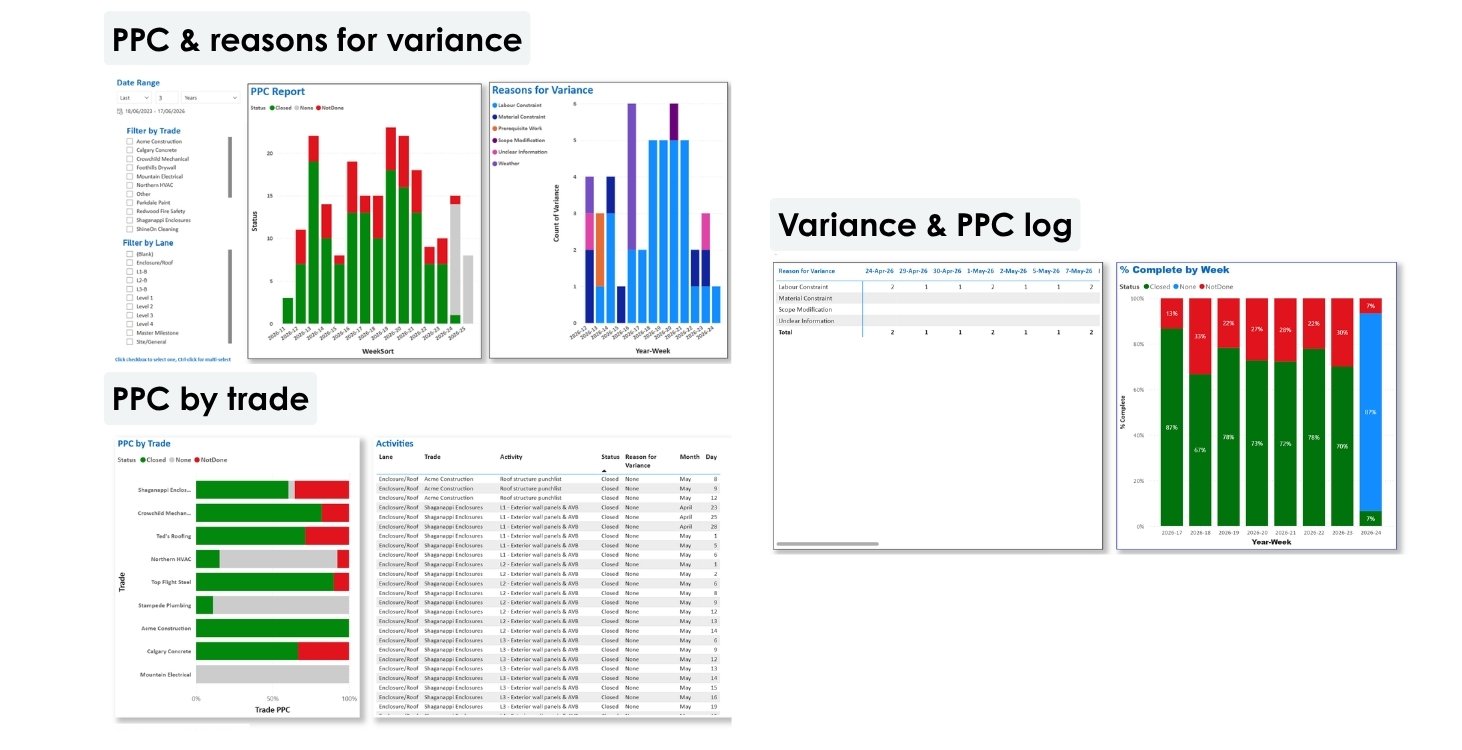
Team performance reports display Percentage Plan Complete (PPC) and reasons for variance data in several different formats, allowing users to perform deeper analysis by trade or area of work.

  • Percentage Plan Complete (PPC) measures the number of activities completed against the number of activities planned. This data is calculated when users status an activity as complete or incomplete.
  • Reasons for variance captures why work did not get completed. Users are prompted to give a reason why (such as weather, material shortages, failed inspection, etc.) when marking a task as incomplete.
Team performance reports - Nialli Visual Planner - Power BI

Resource level reports

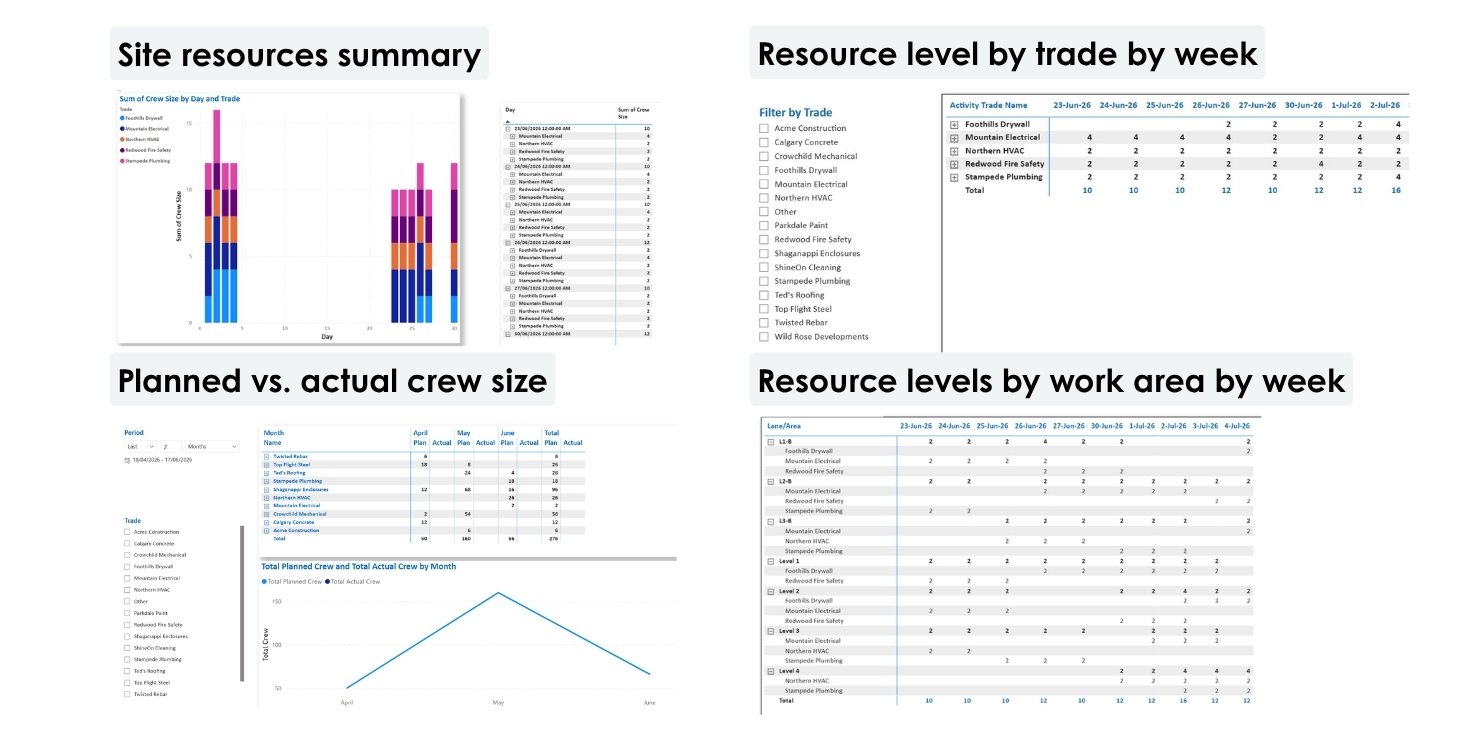
Resource level reports show planned trade activities broken down by week, area of the project and crew size. The planned vs. actual crew report shows a comparison between how many trades were planning to be onsite vs. how many actually showed up.

Resource reports - Nialli Visual Planner - Power BI

Milestone reports

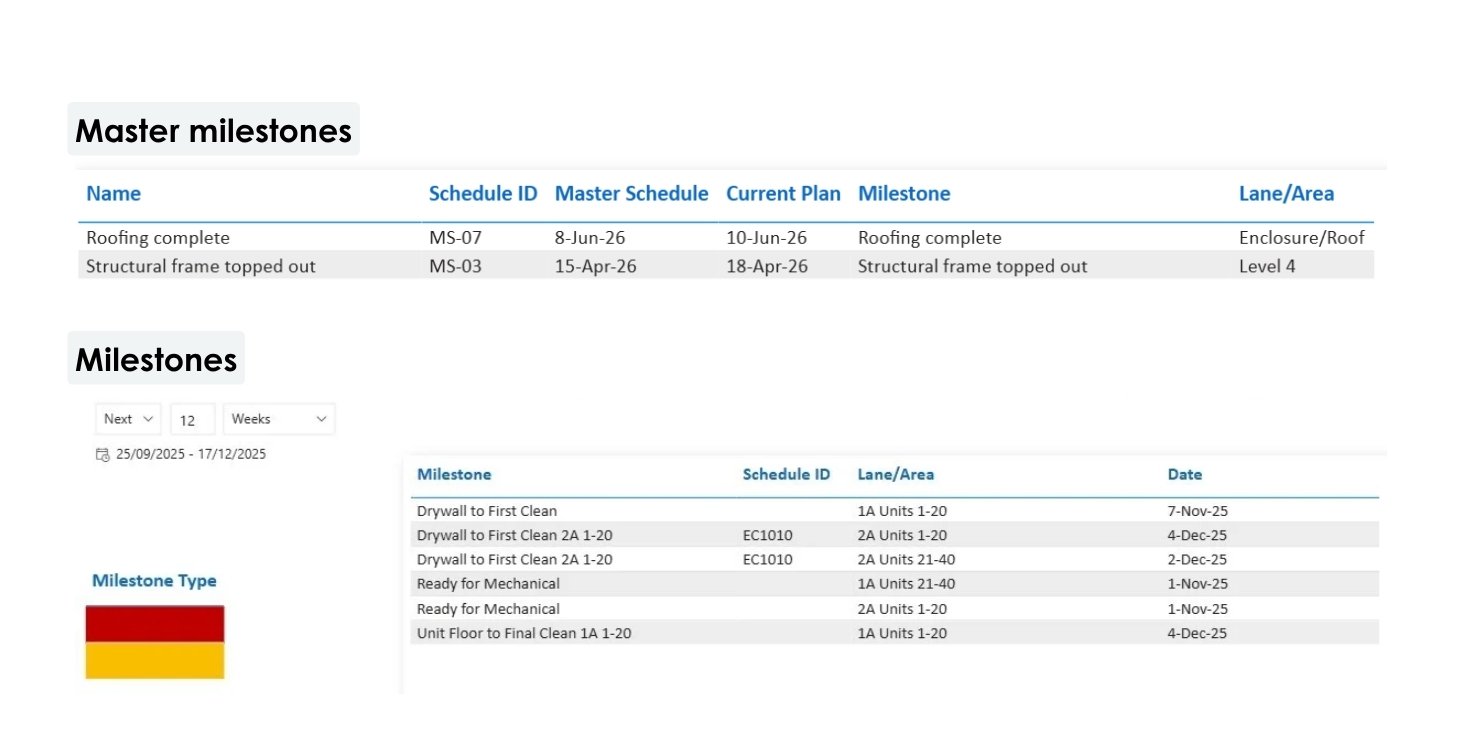
Generate reports on project milestones by type (color coded). If milestones were imported from a master schedule, you can run a comparison between imported milestones and actual milestones, which shows how far milestones are off schedule.

  • Milestones are how key project deadlines get shown in Nialli Visual Planner, visually represented as diamond-shaped squares. Milestones serve as crucial checkpoints on a project that mark the completion of 
    a major phase, critical event or key deliverable in the plan.
Milestone reports - Nialli Visual Planner - Power BI

Activity and outstanding task reports

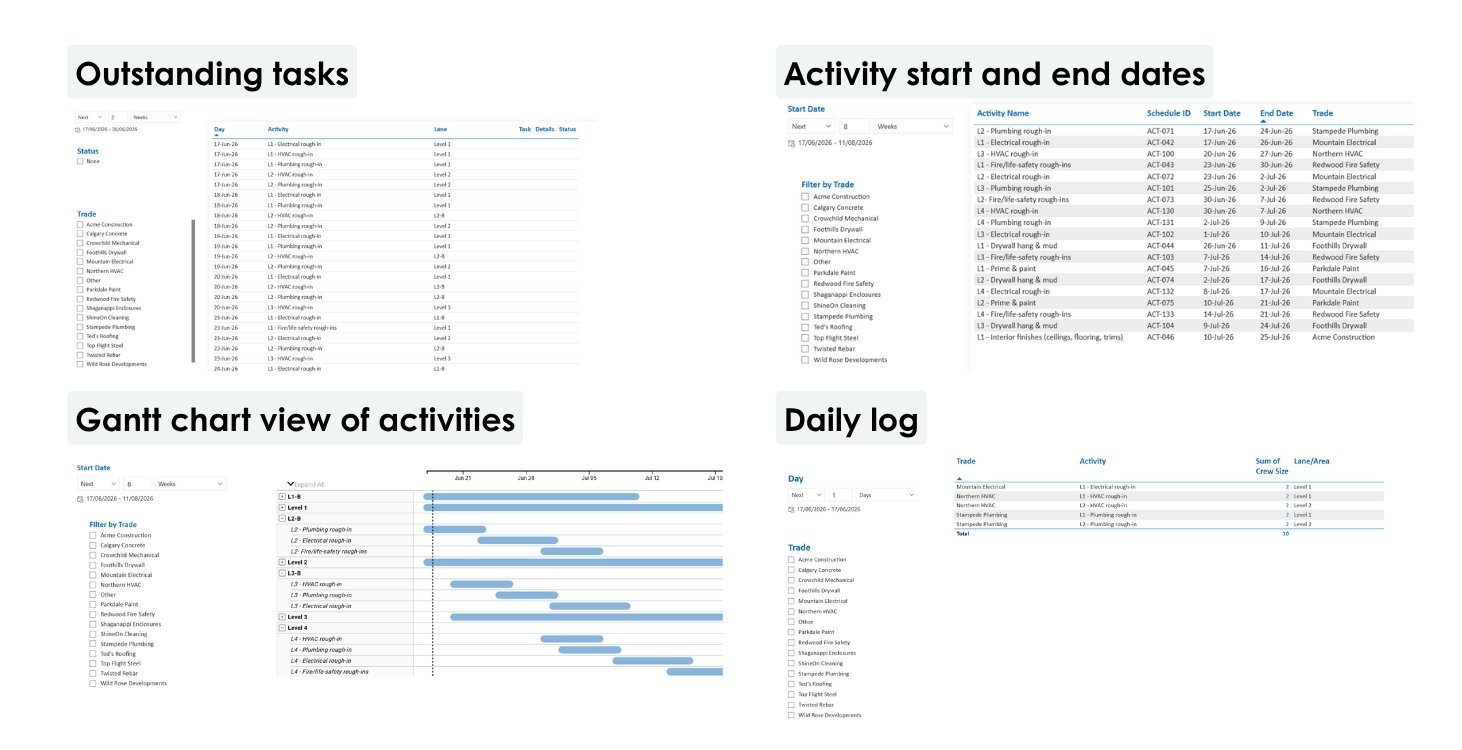
These reports show activity start and end dates, outstanding tasks, a daily log of activities completed, and activities in a gantt chart format.

Activities and Outstanding tasks reports - Nialli Visual Planner - Power BI

Constraints report

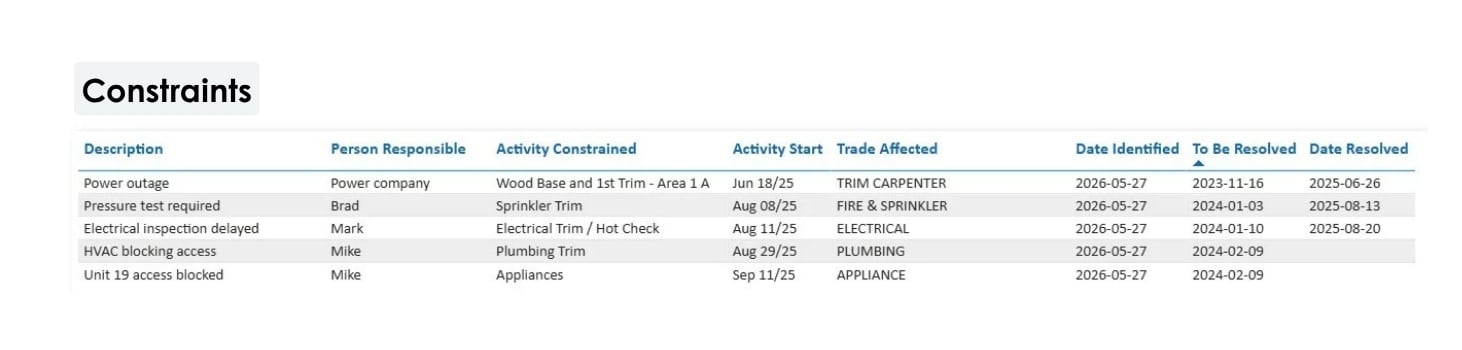
Generate a list of project constraints that can be sorted by resolution date, person responsible or trade affected.

  • Constraints represent issues, conditions or dependencies that must be resolved before an activity can proceed. These may include required inspections, materials availability, approvals or coordination between trades. Each constraint is tied to a specific activity and includes critical details, such as who’s responsible and when it must be resolved.  

Constraints report - Nialli Visual Planner - Power BI

Phase plan reports

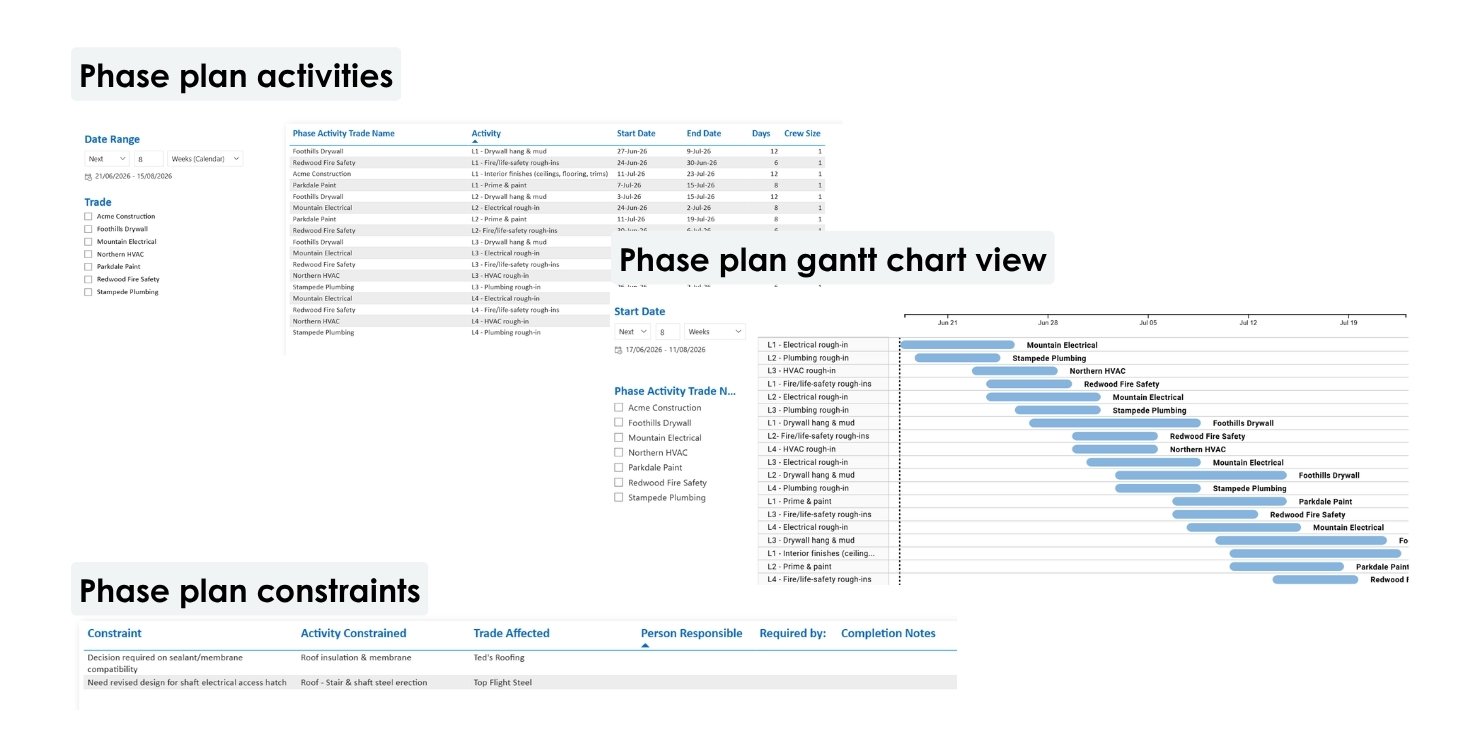
These reports highlight phase planning activities and constraints. A gantt chart view is also available.

Phase plan reports - Nialli Visual Planner - Power BI

Master schedule vs. plan report

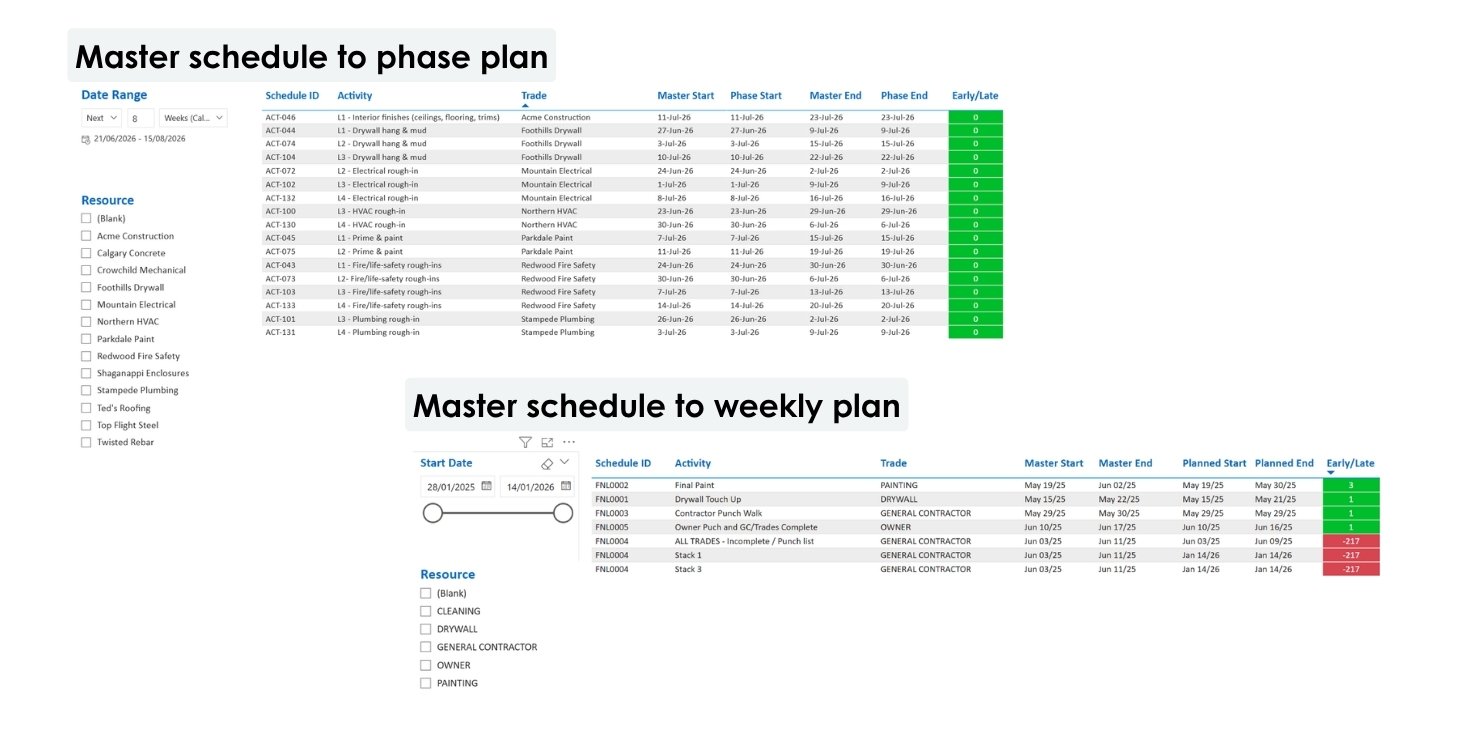
If activities are imported into Nialli Visual Planner from a master schedule (such as Primavera P6, Asta Powerproject, Microsoft Project, etc.), a comparison report can be generated to show whether these activites are early or late in relation to the master schedule. This can be done at both the phase plan level and the weekly plan level.

Master vs. actual reports - Nialli Visual Planner - Power BI